mirror of
https://github.com/poseidon/typhoon
synced 2024-09-22 20:00:49 +02:00
* Collate upstream rules, alerts, and dashboards and tune for use
in Typhoon
* Previously, a well-chosen (but older) set of rules, alerts, and
dashboards were maintained to reflect metric name changes
662 B
662 B
Grafana
Grafana can be used to build dashboards and visualizations that use Prometheus as the datasource. Create the grafana deployment and service.
kubectl apply -f addons/grafana -R
Use kubectl to authenticate to the apiserver and create a local port-forward to the Grafana pod.
kubectl port-forward grafana-POD-ID 8080 -n monitoring
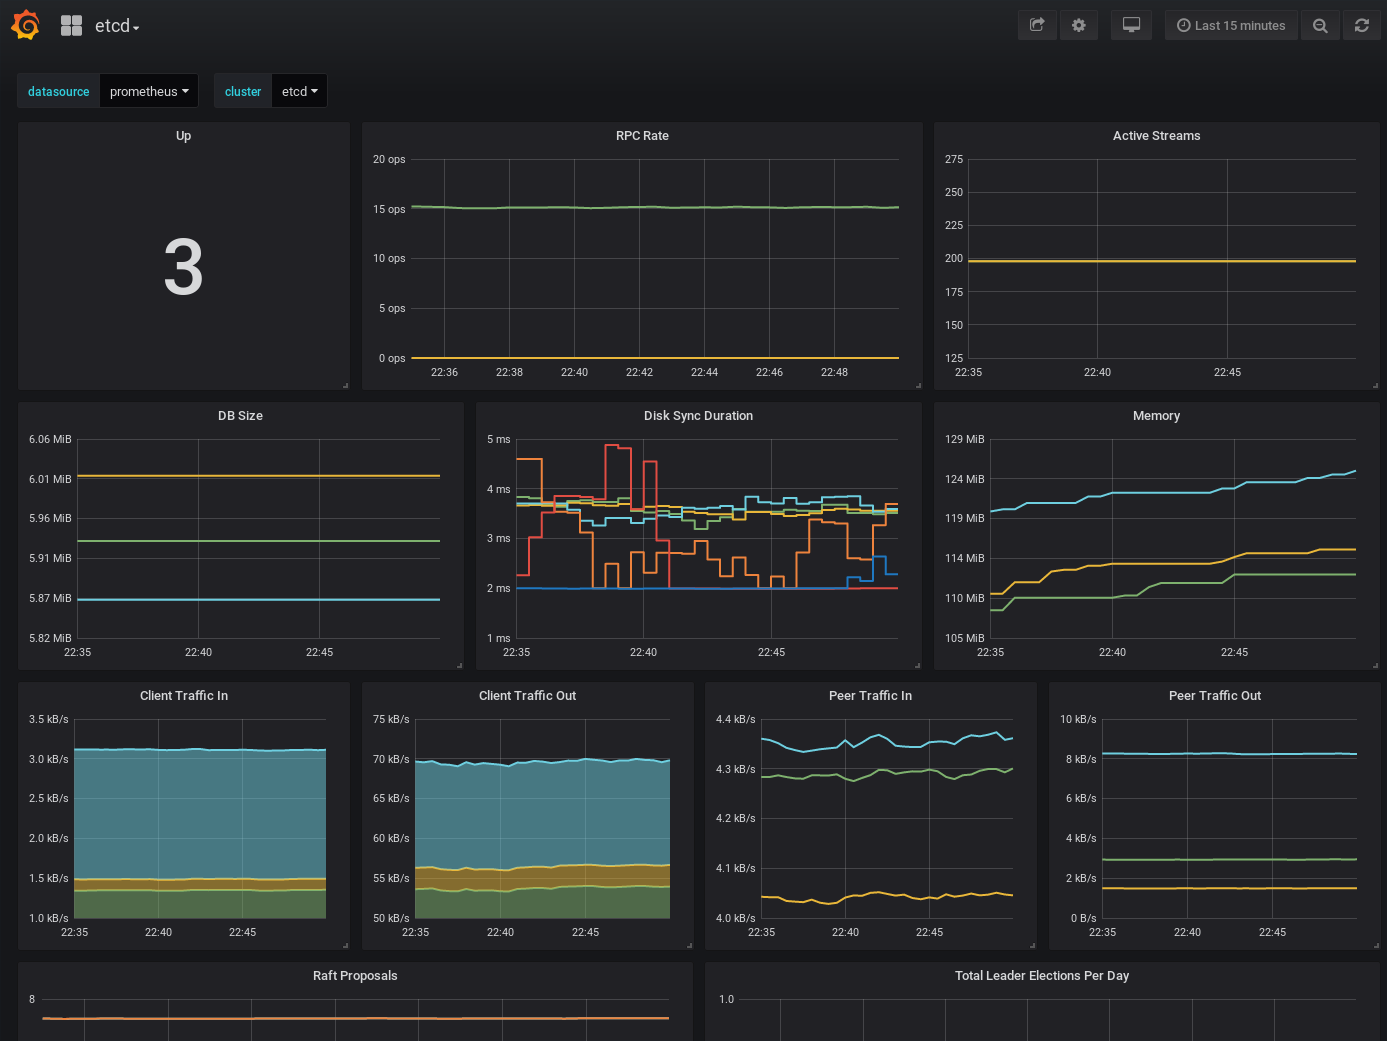
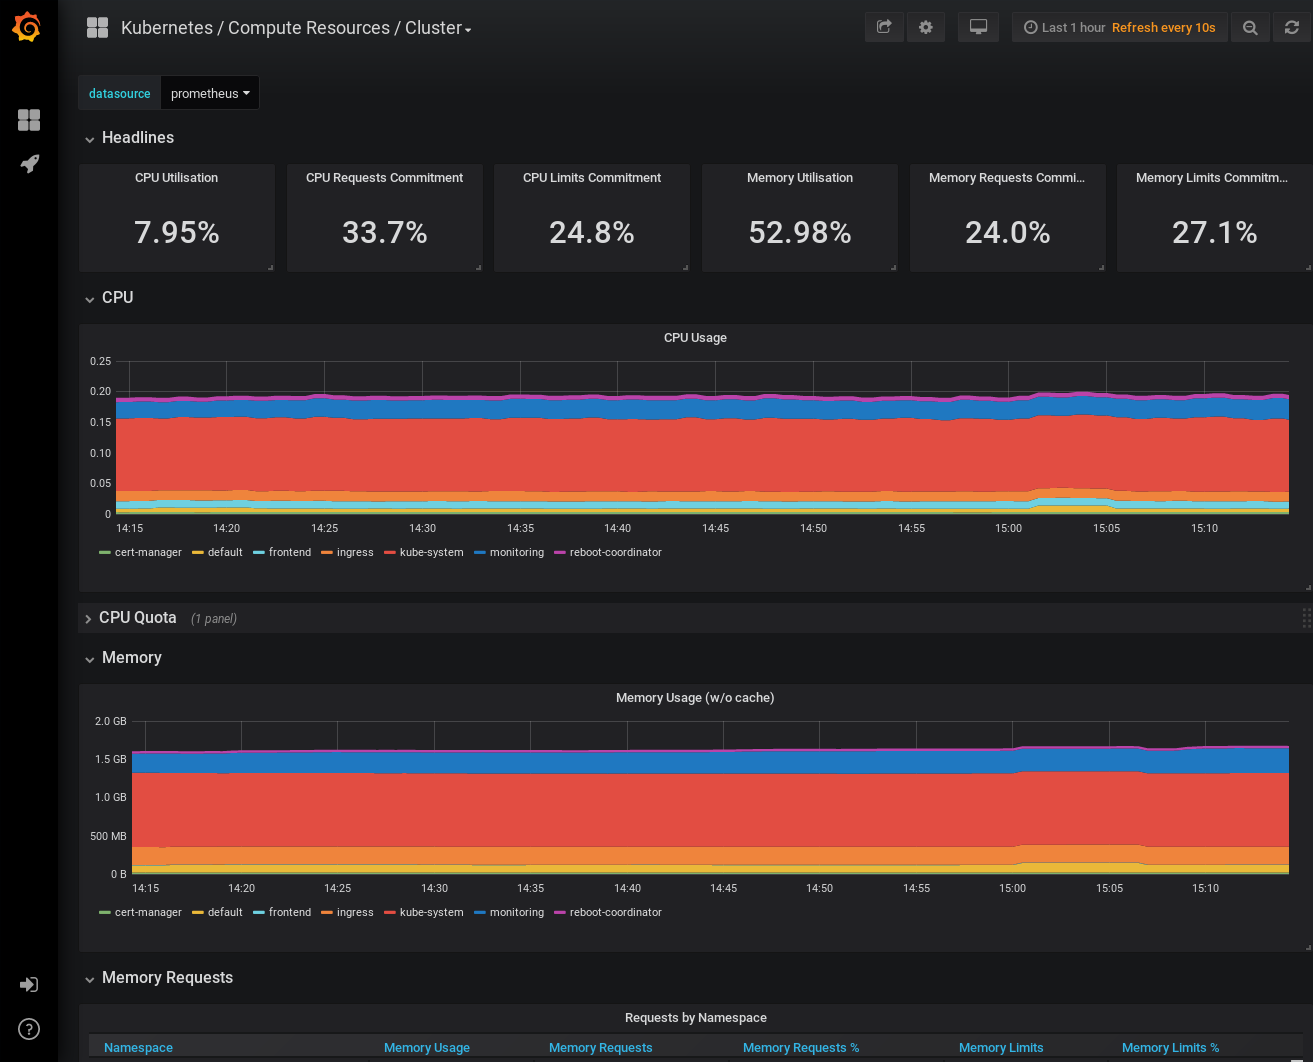
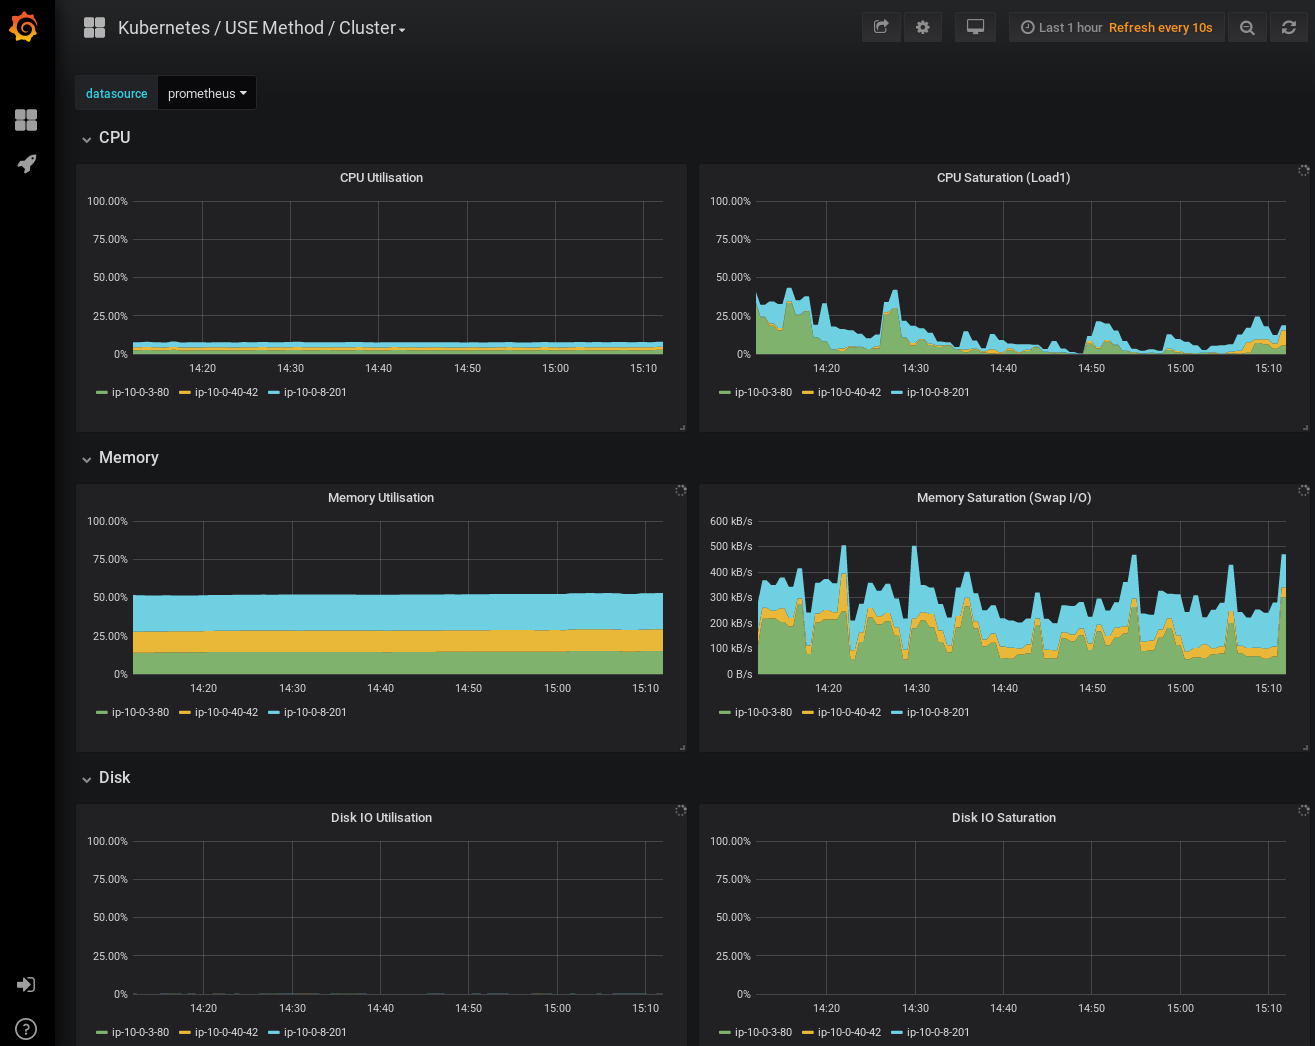
Visit 127.0.0.1:8080 to view the bundled dashboards.