* mkdocs v1.0 now evaluates links beginning with / as
absolute links that are only prepended with the site url
2.2 KiB
Prometheus
Prometheus collects metrics (e.g. node_memory_usage_bytes) from targets by scraping their HTTP metrics endpoints. Targets are organized into jobs, defined in the Prometheus config. Targets may expose counter, gauge, histogram, or summary metrics.
Here's a simple config from the Prometheus tutorial.
global:
  scrape_interval: 15s
scrape_configs:
  - job_name: 'prometheus'
    scrape_interval: 5s
    static_configs:
      - targets: ['localhost:9090']
On Kubernetes clusters, Prometheus is run as a Deployment, configured with a ConfigMap, and accessed via a Service or Ingress.
kubectl apply -f addons/prometheus -R
The ConfigMap configures Prometheus to discover apiservers, kubelets, cAdvisor, services, endpoints, and exporters. By default, data is kept in an emptyDir so it is persisted until the pod is rescheduled.
Exporters
Exporters expose metrics for 3rd-party systems that don't natively expose Prometheus metrics.
- node_exporter - DaemonSet that exposes a machine's hardware and OS metrics
- kube-state-metrics - Deployment that exposes Kubernetes object metrics
- blackbox_exporter - Scrapes HTTP, HTTPS, DNS, TCP, or ICMP endpoints and exposes availability as metrics
Queries and Alerts
Prometheus provides a basic UI for querying metrics and viewing alerts. Use kubectl to authenticate to the apiserver and create a local port-forward to the Prometheus pod.
kubectl get pods -n monitoring
kubectl port-forward prometheus-POD-ID 9090 -n monitoring
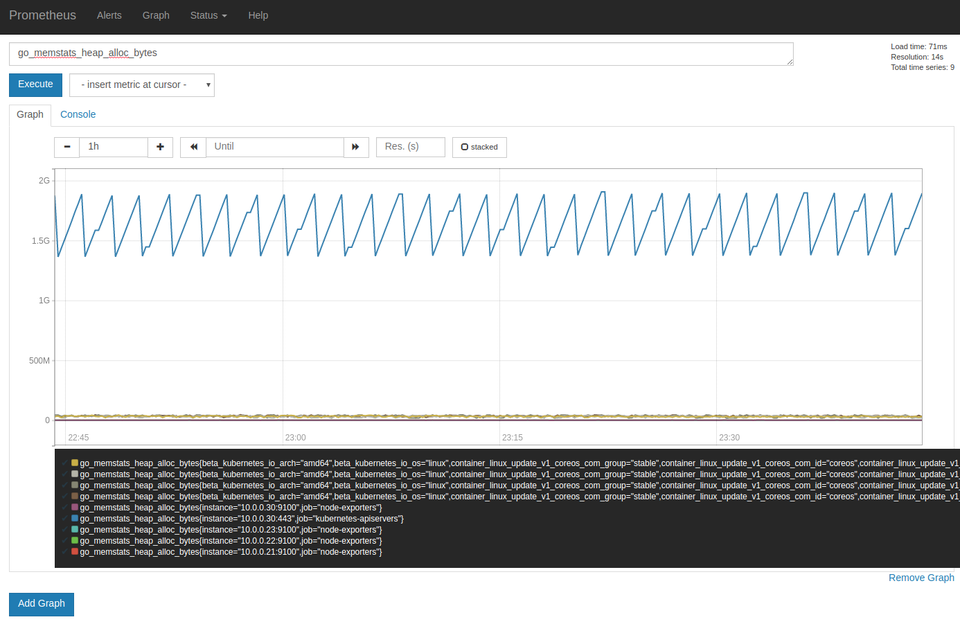
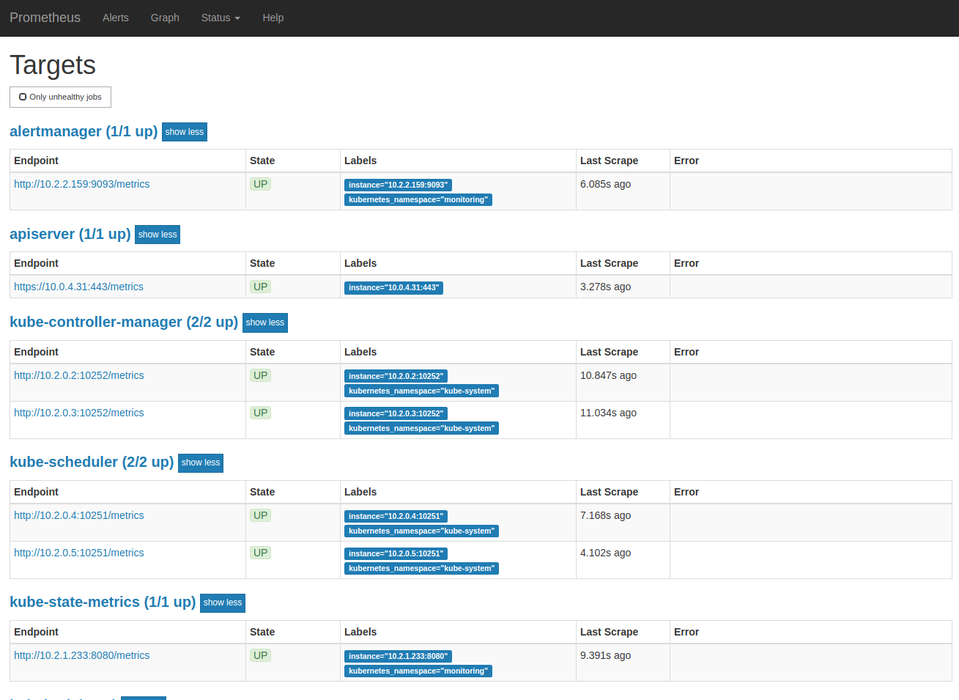
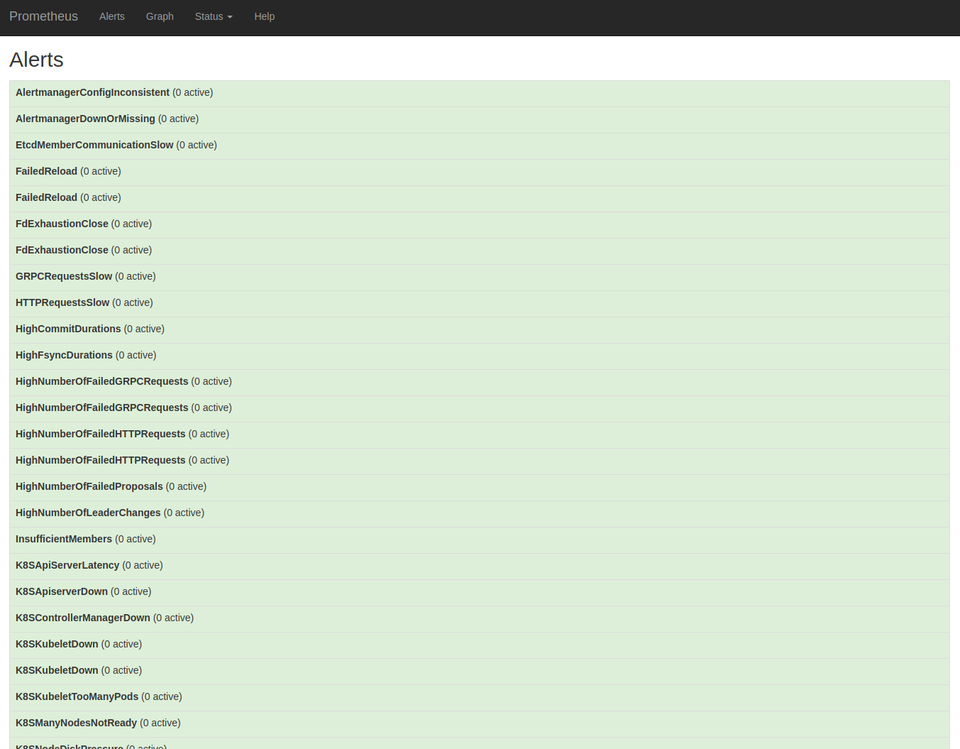
Visit 127.0.0.1:9090 to query expressions, view targets, or check alerts.
Use Grafana to view or build dashboards that use Prometheus as the datasource.